When querying a data model containing a hierarchy of URL images, that hierarchy may be added to Grids and Cartesian charts to display the images in the query. You can then change the size of the images as required.
Note: The Image Size formatting option only affects the size of images where the Image URL hierarchy is added to one of the main drop zones. For Grids, the main drop zones are Rows and Columns. For Charts, they are Categories and Trellises.
Resizing Images
This topic describes how to change the size of the images added to your visual as Image URL hierarchies.
Before you begin
This topic assumes an Image URL hierarchy has been added to the discovery in one of the relevant drop zones.
- Click here to learn about adding image URLs to discoveries
Changing the Image Size
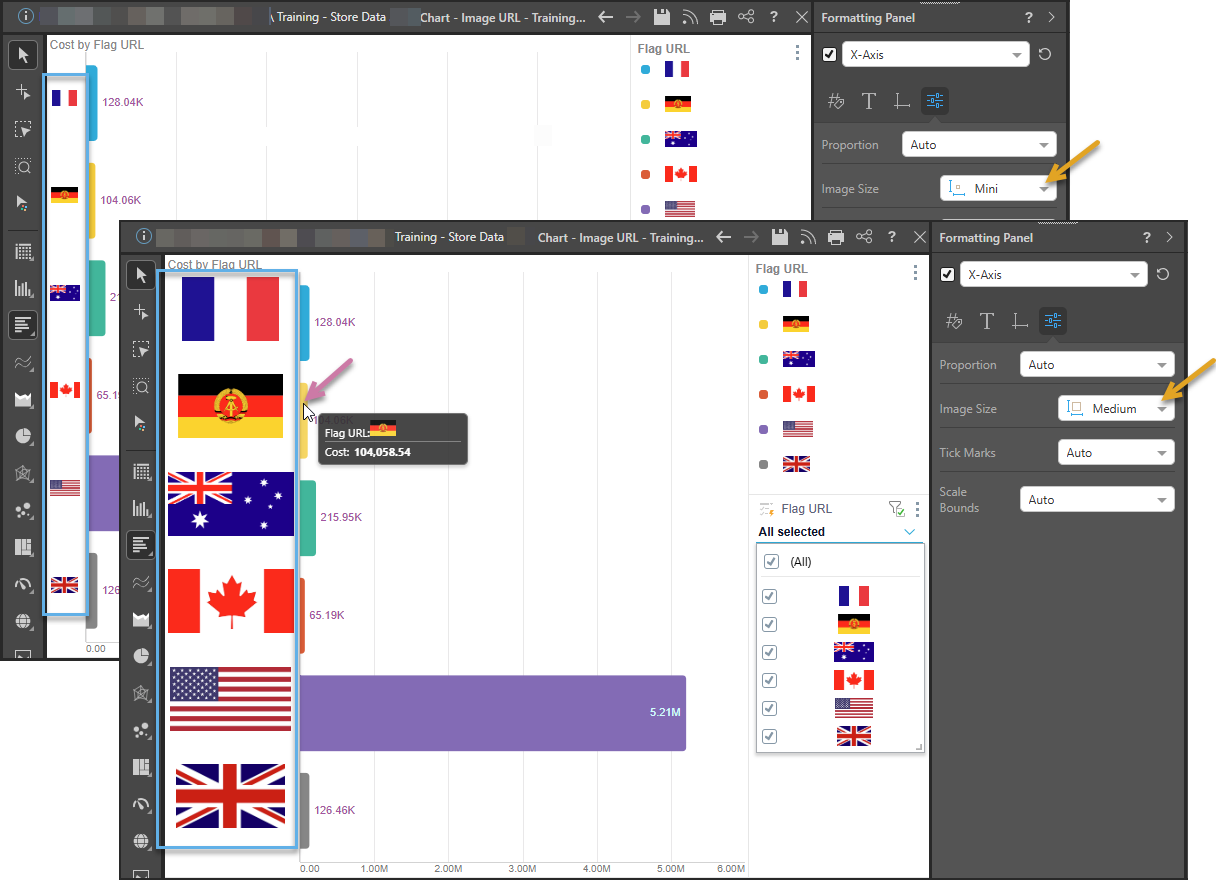
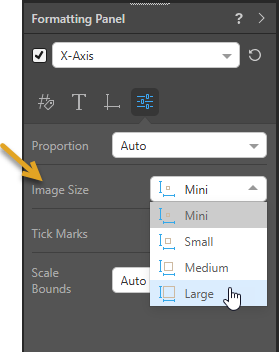
To alter the size of your images, use the Image Size option in the Formatting panel. For Grids, this option is seen when you select Rows or Columns in the Formatting panel. For Cartesian Charts, it is seen when you select X-Axis (orange arrow below). Selecting an Image Size option affects the size of all URL images in the main drop zones (Rows and Columns, or Categories and Trellises).
In the following example, the image hierarchy was added to a Bar Chart and the Image Size in the Formatting panel was changed from Mini to Medium (orange arrows below). The change affects the images on the main axis, but does not affect the same images where they appear in the Tooltip (purple arrow), in the Legend, or in the slicer: